Making plots with world coordinates (WCSAxes)#
WCSAxes is a framework for making plots of Astronomical data in Matplotlib.
It was previously distributed as a standalone package (wcsaxes), but is now included in
astropy.visualization.
Getting started#
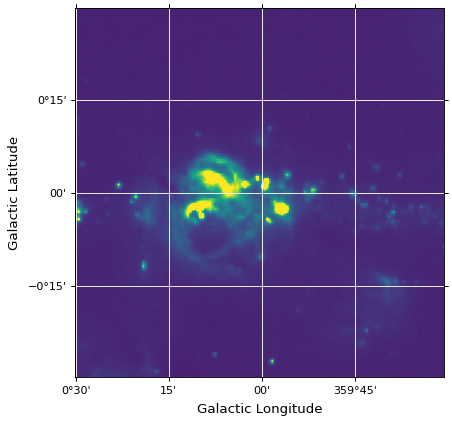
The following is a very simple example of plotting an image with the WCSAxes package:
import matplotlib.pyplot as plt

from astropy.wcs import WCS
from astropy.io import fits
from astropy.utils.data import get_pkg_data_filename

filename = get_pkg_data_filename('galactic_center/gc_msx_e.fits')

hdu = fits.open(filename)[0]
wcs = WCS(hdu.header)

fig, ax = plt.subplots(subplot_kw=dict(projection=wcs))
ax.imshow(hdu.data, vmin=-2.e-5, vmax=2.e-4, origin='lower')
ax.grid(color='white', ls='solid')
ax.set(xlabel='Galactic Longitude', ylabel='Galactic Latitude')

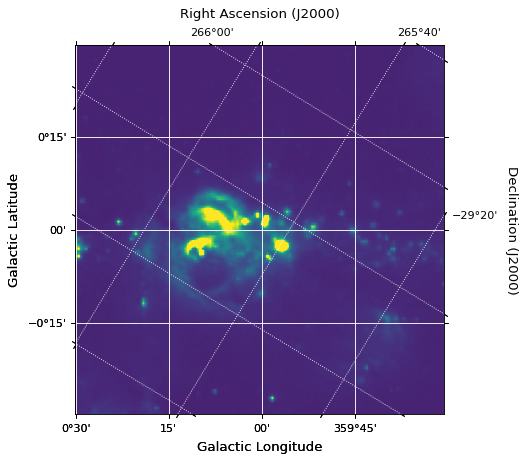
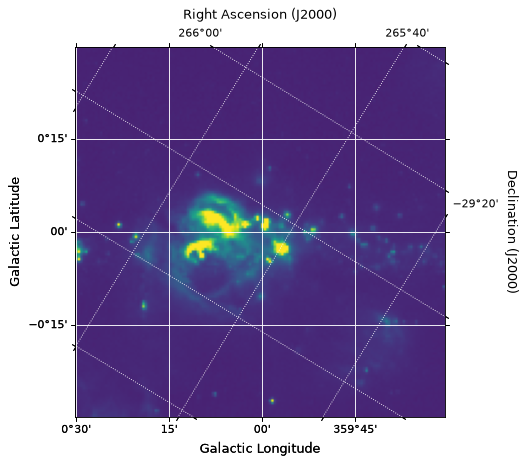
The above example uses the partially-object oriented matplotlib interface (keeping explicit references to figure and axes objects), as opposed to the pyplot interface. Note that this needed to access some of the more advanced functionality of WCSAxes. An example of this usage is:
ax = fig.add_subplot(projection=wcs, label='overlays')

ax.imshow(hdu.data, vmin=-2.e-5, vmax=2.e-4, origin='lower')

ax.coords.grid(True, color='white', ls='solid')
ax.coords[0].set_axislabel('Galactic Longitude')
ax.coords[1].set_axislabel('Galactic Latitude')

overlay = ax.get_coords_overlay('fk5')
overlay.grid(color='white', ls='dotted')
overlay[0].set_axislabel('Right Ascension (J2000)')
overlay[1].set_axislabel('Declination (J2000)')
In the rest of this documentation we will assume that you have kept a reference
to the axes object, which we will refer to as ax. However, we also note
when something can be done directly with the pyplot interface.
WCSAxes supports a number of advanced plotting options, including the ability to control which axes to show labels on for which coordinates, overlaying contours from data with different coordinate systems, overlaying grids for different coordinate systems, dealing with plotting slices from data with more dimensions than the plot, and defining custom (non-rectangular) frames.
Using WCSAxes#
Reference/API#
astropy.visualization.wcsaxes Package#
Functions#
|
Display the beam shape and size. |
|
Add a scale bar. |
|
A context manager that makes it possible to temporarily add new UCD+ to WCS coordinate plot metadata mappings. |
Classes#
|
Configuration parameters for |
|
Helper class to control one of the coordinates in the |
|
A container for coordinate helpers that represents a coordinate system. |
|
Create a patch representing a latitude-longitude quadrangle. |
|
Create a patch representing a spherical circle - that is, a circle that is formed of all the points that are within a certain angle of the central coordinates on a sphere. |
|
The main axes class that can be used to show world coordinates from a WCS. |
|
A subclass class for WCSAxes. |
astropy.visualization.wcsaxes.frame Module#
Classes#
|
Base class for frames, which are collections of |
|
An elliptical frame. |
|
A classic rectangular frame. |
|
A classic rectangular frame. |
|
A single side of an axes. |