Initializing WCSAxes with custom transforms#
In Initializing axes with world coordinates, we saw how to make plots using
WCS objects. However, the
WCSAxes class can also be initialized
with more general transformations that don’t have to be represented by the
WCS class. Instead, you can initialize
WCSAxes using a Matplotlib
Transform object and a dictionary
(coord_meta) that provides metadata on how to interpret the transformation.
The Transform should represent the conversion
from pixel to world coordinates, and should have input_dims=2 and can have
output_dims set to any positive integer. In addition, has_inverse should
be set to True and the inverted method should be implemented.
The coord_meta dictionary should include the following keys:
name: an iterable of strings giving the names for each dimensiontype: an iterable of strings that should be either'longitude','latitude', or'scalar'(for anything that isn’t a longitude or latitude).wrap: an iterable of values which indicate for longitudes at which angle (in degrees) to wrap the coordinates. This should beNoneunlesstypeis'longitude'.unit: an iterable ofUnitobjects giving the units of the world coordinates returned by theTransform.format_unit: an iterable ofUnitobjects giving the units to use for the formatting of the labels. These can be set toNoneto default to the units given inunit, but can be set for example if theTransformreturns values in degrees and you want the labels to be formatted in hours.
In addition the coord_meta can optionally include the following keys:
default_axislabel_position: an iterable of strings giving for each world coordinates the spine of the frame on which to show the axis label for the coordinate. Each string should be such that it could be used as input toset_axislabel_position().default_ticklabel_position: an iterable of strings giving for each world coordinates the spine of the frame on which to show the tick labels for the coordinate. Each string should be such that it could be used as input toset_ticklabel_position().default_ticks_position: an iterable of strings giving for each world coordinates the spine of the frame on which to show the ticks for the coordinate. Each string should be such that it could be used as input toset_ticks_position().
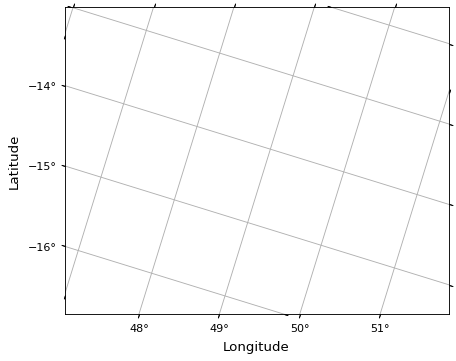
The following example illustrates a custom projection using a transform and
coord_meta:
from astropy import units as u
import matplotlib.pyplot as plt
from matplotlib.transforms import Affine2D
from astropy.visualization.wcsaxes import WCSAxes

# Set up an affine transformation
transform = Affine2D()
transform.scale(0.01)
transform.translate(40, -30)
transform.rotate(0.3)  # radians

# Set up metadata dictionary
coord_meta = {}
coord_meta['name'] = 'lon', 'lat'
coord_meta['type'] = 'longitude', 'latitude'
coord_meta['wrap'] = 180 * u.deg, None
coord_meta['unit'] = u.deg, u.deg
coord_meta['format_unit'] = None, None

fig = plt.figure()
ax = WCSAxes(fig, [0.1, 0.1, 0.8, 0.8], aspect='equal',
             transform=transform, coord_meta=coord_meta)
fig.add_axes(ax)
ax.set_xlim(-0.5, 499.5)
ax.set_ylim(-0.5, 399.5)
ax.grid()
ax.coords['lon'].set_axislabel('Longitude')
ax.coords['lat'].set_axislabel('Latitude')