Ticks, tick labels, and grid lines#
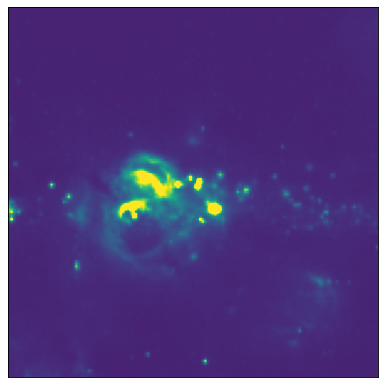
For the example in the following page we start from the example introduced in Initializing axes with world coordinates.
Coordinate objects#
While for many images, the coordinate axes are aligned with the pixel axes, this is not always the case, especially if there is any rotation in the world coordinate system, or in coordinate systems with high curvature, where the coupling between x- and y-axis to actual coordinates become less well-defined.
Therefore rather than referring to x and y ticks as Matplotlib does,
we use specialized objects to access the coordinates. The coordinates used in
the plot can be accessed using the coords attribute of the axes. As a
reminder, if you use the pyplot interface, you can grab a reference to the axes
when creating a subplot:
ax = plt.subplot()
or you can call plt.gca() at any time to get the current active axes:
ax = plt.gca()
If you use the object-oriented interface to Matplotlib, you should already have a reference to the axes.
Once you have an axes object, the coordinates can either be accessed by index:
lon = ax.coords[0]
lat = ax.coords[1]
or, in the case of common coordinate systems, by their name:
lon = ax.coords['glon']
lat = ax.coords['glat']
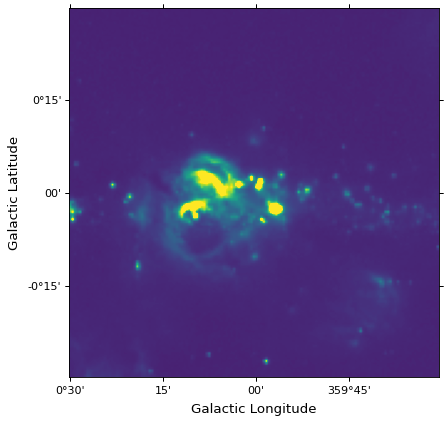
In this example, the image is in Galactic coordinates, so the coordinates are
called glon and glat. For an image in equatorial coordinates, you
would use ra and dec. The names are only available for specific
celestial coordinate systems - for all other systems, you should use the index
of the coordinate (0 or 1).
Each coordinate is an instance of the
CoordinateHelper class, which can be used
to control the appearance of the ticks, tick labels, grid lines, and axis
labels associated with that coordinate.
Axis labels#
Axis labels can be added using the
set_axislabel() method:
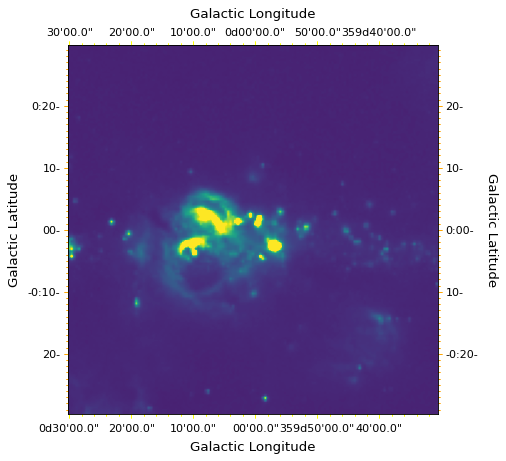
lon.set_axislabel('Galactic Longitude')
lat.set_axislabel('Galactic Latitude')

The padding of the axis label with respect to the axes can also be adjusted by
using the minpad option. The default value for minpad is 1 and is in
terms of the font size of the axis label text. Negative values are also
allowed.
lon.set_axislabel('Galactic Longitude', minpad=0.3)
lat.set_axislabel('Galactic Latitude', minpad=-0.4)

Note
Note that, as shown in Getting started, it is also
possible to use the normal plt.xlabel or ax.set_xlabel
notation to set the axis labels in the case where they do appear on
the x and y axis.
Tick label format#
The format of the tick labels can be specified with a string describing the format:
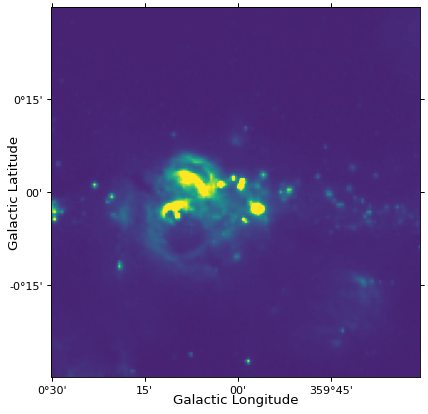
lon.set_major_formatter('dd:mm:ss.s')
lat.set_major_formatter('dd:mm')

The syntax for the format string is the following:
format |
result |
|---|---|
|
|
|
|
|
|
|
|
|
|
|
|
|
|
|
|
|
|
|
|
|
|
|
|
|
|
|
|
|
|
|
|
|
|
|
|
|
|
|
|
|
|
|
|
|
|
|
|
All the h..., d..., m..., and s... formats should be used for
angular coordinate axes, while the x... format or valid Python formats
(see String Formatting Operations) should
be used for non-angular coordinate axes.
For decimal formats, such as d.dd or x.xxx, the units are shown by
default, and can be disabled by using show_decimal_unit, e.g.:
lon.set_major_formatter('d.dd', show_decimal_unit=False)
lat.set_major_formatter('d.ddd')
For any of the angular coordinate formats, one can prefix the format string
with + to specify that the sign be included even for positive values, e.g.:
format |
result |
|---|---|
|
|
|
|
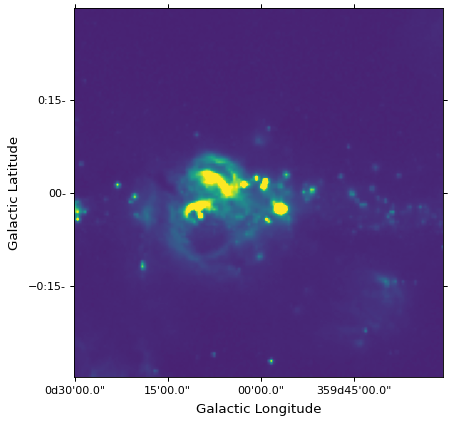
The separators for angular coordinate tick labels can also be set by specifying a string or a tuple.
lon.set_separator(('d', "'", '"'))
lat.set_separator(':-s')
Tick/label spacing and properties#
The spacing of ticks/tick labels should have a sensible default, but you may
want to be able to manually specify the spacing. This can be done using the
set_ticks() method. There
are different options that can be used:
Set the tick positions manually as an Astropy
Quantity:from astropy import units as u lon.set_ticks([242.2, 242.3, 242.4] * u.degree)
Set the spacing between ticks also as an Astropy
Quantity:lon.set_ticks(spacing=5. * u.arcmin)
Set the approximate number of ticks:
lon.set_ticks(number=4)
In the case of angular axes, specifying the spacing as an Astropy
Quantity avoids roundoff errors. The
set_ticks() method can also
be used to set the appearance (color and size) of the ticks, using the
color= and size= options.
The set_ticklabel() method can be used
to change settings for the tick labels, such as color, font, size, and so on:
lon.set_ticklabel(color='red', size=12)
In addition, this method has an option exclude_overlapping=True to prevent
overlapping tick labels from being displayed.
We can apply this to the previous example:
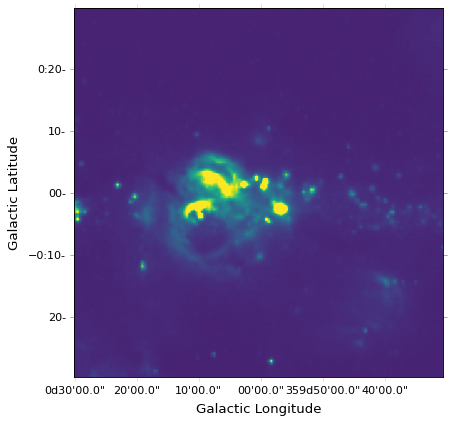
from astropy import units as u
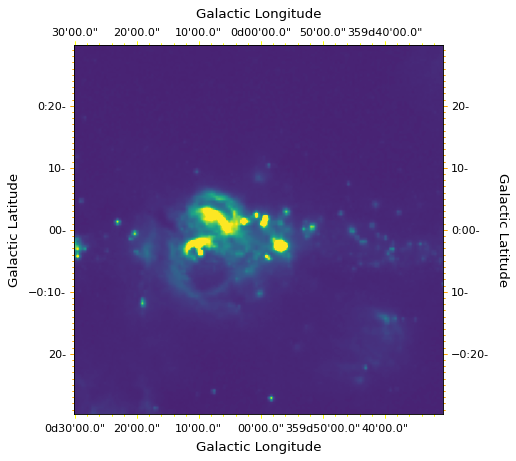
lon.set_ticks(spacing=10 * u.arcmin, color='yellow')
lat.set_ticks(spacing=10 * u.arcmin, color='orange')
lon.set_ticklabel(exclude_overlapping=True)
lat.set_ticklabel(exclude_overlapping=True)

By default, repeated parts of tick labels (e.g., the whole degrees or hour
angle) are omitted to keep the tick labels shorter. If this simplification
results in confusing tick labels, this behavior can be disabled by specifying
simplify=False:
lon.set_ticklabel(simplify=False)
lat.set_ticklabel(simplify=False)
Minor ticks#
WCSAxes does not display minor ticks by default but these can be shown by
using the
display_minor_ticks()
method. The default frequency of minor ticks is 5 but this can also be
specified.
lon.display_minor_ticks(True)
lat.display_minor_ticks(True)
lat.set_minor_frequency(10)
Tick, tick label, and axis label position#
By default, WCSAxes automatically decides which coordinates to show on which axes in order to minimize cases where some coordinates have no or too few tick labels. In addition, in the cases of 2-d WCS and rectangular frames the ticks for both coordinates are shown on all axes.
However, this automated behavior can be overridden and positions can be
explicitly specified for different coordinates using the
set_ticks_position(),
set_ticklabel_position(), and
set_axislabel_position() methods,
which each
take a string or sequence that can contain any or several of l, b, r, or t
(indicating the ticks or tick labels should be shown on the left, bottom,
right, or top axes respectively), e.g:
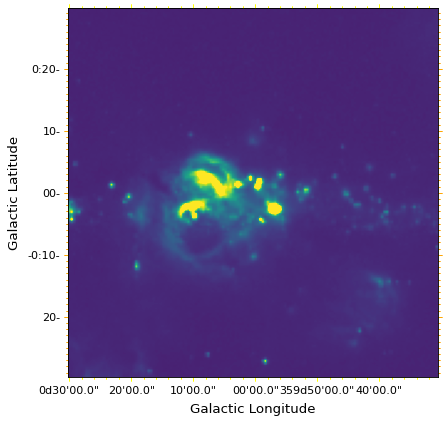
lon.set_ticks_position('bt')
lon.set_ticklabel_position('bt')
lon.set_axislabel_position('bt')
lat.set_ticks_position('lr')
lat.set_ticklabel_position('lr')
lat.set_axislabel_position('lr')
In practice, in the above example you should be able to specify just the tick label positions:
lon.set_ticklabel_position('bt')
lat.set_ticklabel_position('lr')
because the ticks and axis labels default to being shown on the same axes as the tick labels.
If you want to switch back to automated positioning, you can specify a string with
a single #:
lon.set_ticks_position('#')
lon.set_ticklabel_position('#')
lon.set_axislabel_position('#')
lat.set_ticks_position('#')
lat.set_ticklabel_position('#')
lat.set_axislabel_position('#')

The # indicates that the positions should be re-assigned dynamically every
time the axes are drawn.
On plots with elliptical frames, three alternate tick positions are supported:
c for the outer circular or elliptical border, h for the horizontal
axis (which is usually the major axis of the ellipse), and v for the
vertical axis (which is usually the minor axis of the ellipse).
Hiding ticks and tick labels#
Sometimes it’s desirable to hide ticks and tick labels. A common scenario
is where WCSAxes is being used in a grid of subplots and the tick labels
are redundant across rows or columns. Tick labels and ticks can be hidden with
the set_ticklabel_visible()
and set_ticks_visible()
methods, respectively:
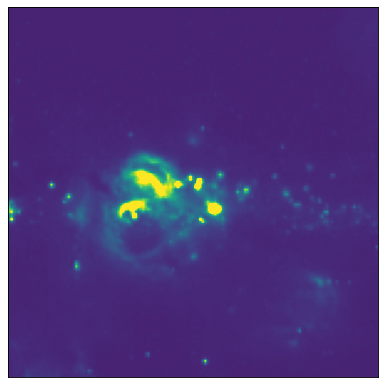
lon.set_ticks_visible(False)
lon.set_ticklabel_visible(False)
lat.set_ticks_visible(False)
lat.set_ticklabel_visible(False)
lon.set_axislabel('')
lat.set_axislabel('')

And we can restore the ticks and tick labels again using:
lon.set_ticks_visible(True)
lon.set_ticklabel_visible(True)
lat.set_ticks_visible(True)
lat.set_ticklabel_visible(True)
lon.set_axislabel('Galactic Longitude')
lat.set_axislabel('Galactic Latitude')

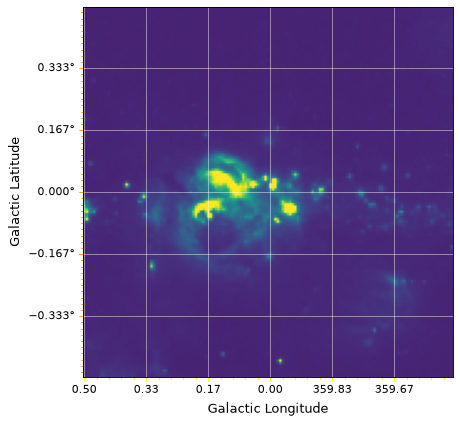
Coordinate grid#
Since the properties of a coordinate grid are linked to the properties of the ticks and labels, grid lines ‘belong’ to the coordinate objects described above. You can draw the grid for all coordinates at once:
ax.coords.grid(color='white', alpha=0.5, linestyle='solid')
Note
If you use the pyplot interface, you can also plot the grid using
plt.grid().
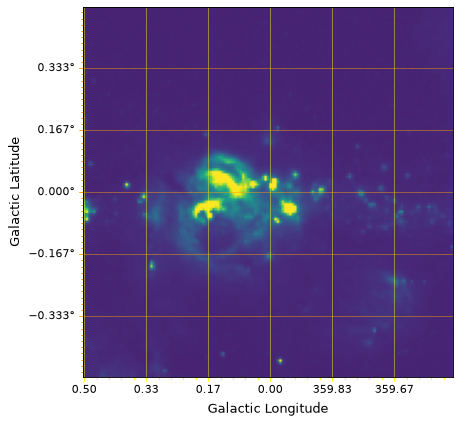
Alternatively, you can draw the grid with different colors for the different coordinates. For example, you can show a grid with yellow lines for RA and orange lines for declination with:
lon.grid(color='yellow', alpha=0.5, linestyle='solid')
lat.grid(color='orange', alpha=0.5, linestyle='solid')

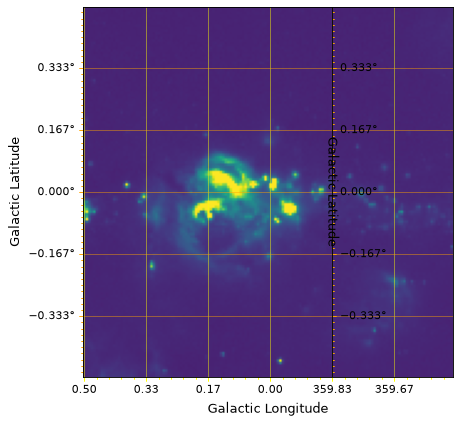
Interior ticks and tick labels#
The default locations of ticks and tick labels for the rectangular frame are the
edges of the frame. To place ticks or tick labels in the interior of the plot,
one needs to add a “tickable” gridline. Here we create one called i at the
constant longitude of -10 arcmin, and then specify that it should have latitude
ticks.
lon.add_tickable_gridline('i', -10*u.arcmin)

lat.set_ticks_position('li')
lat.set_ticklabel_position('li')
