Plotting images and contours#
For the example in the following page we start from the example introduced in Initializing axes with world coordinates.
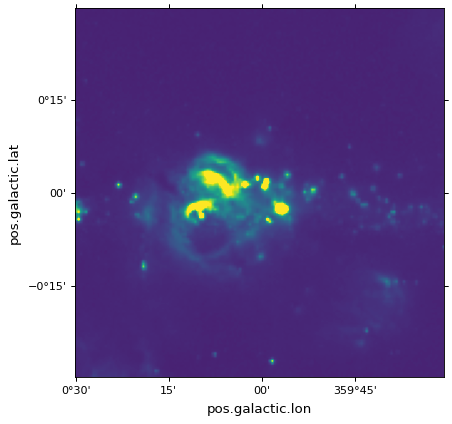
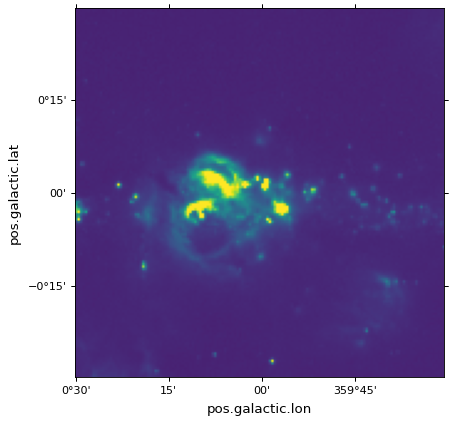
Plotting images as bitmaps or contours should be done via the usual matplotlib
methods such as imshow() or
contour(). For example, continuing from the
example in Initializing axes with world coordinates, you can do:
ax.imshow(hdu.data, vmin=-2.e-5, vmax=2.e-4, origin='lower')
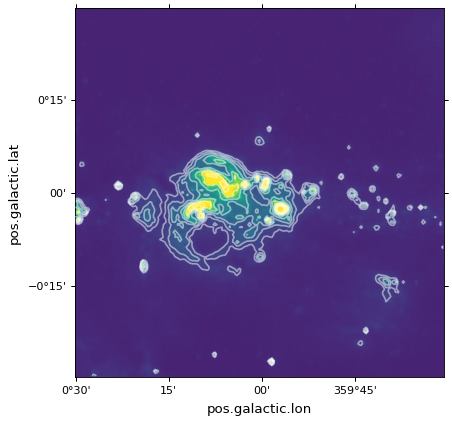
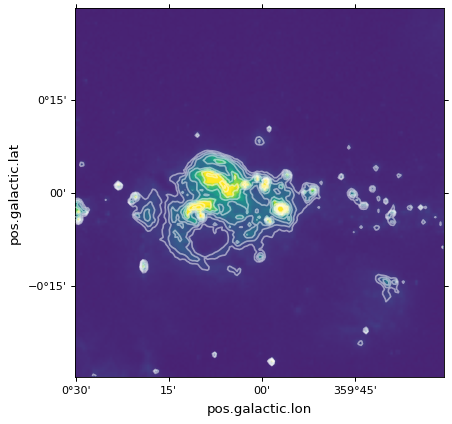
and we can also add contours corresponding to the same image using:
import numpy as np
ax.contour(hdu.data, levels=np.logspace(-4.7, -3., 10), colors='white', alpha=0.5)
To show contours for an image in a different coordinate system, see Overplotting markers and artists.
Note
If you like using the pyplot interface, you can also call
plt.imshow and plt.contour instead of ax.imshow and
ax.contour.