
Note
Go to the end to download the full example code
Create a new coordinate frame class for Mars#
This example describes how to subclass and define a custom coordinate frame for a planetary body which can be described by a geodetic or bodycentric representation, as discussed in Defining a New Frame and Creating Your Own Geodetic and Bodycentric Representations.
Note that we use the frame here only to store coordinates. To use it to determine, e.g., where to point a telescope on Earth to observe Olympus Mons, one would need to add the frame to the transfer graph, which is beyond the scope of this example.
To do this, first we need to define a subclass of a
BaseGeodeticRepresentation and
BaseBodycentricRepresentation, then a subclass of
BaseCoordinateFrame using the previous defined
representations.
By: Chiara Marmo, Marten van Kerkwijk
License: BSD
Set up numpy, matplotlib, and use a nicer set of plot parameters:
import matplotlib.pyplot as plt
import numpy as np

from astropy.visualization import astropy_mpl_style, quantity_support

plt.style.use(astropy_mpl_style)
quantity_support()
<astropy.visualization.units.quantity_support.<locals>.MplQuantityConverter object at 0x7f2060f6f910>
Import the packages necessary for coordinates
import astropy.units as u
from astropy.coordinates.baseframe import BaseCoordinateFrame
from astropy.coordinates.representation import CartesianRepresentation
from astropy.coordinates.representation.geodetic import (
    BaseBodycentricRepresentation,
    BaseGeodeticRepresentation,
)
The first step is to create a new class, and make it a subclass of
BaseGeodeticRepresentation.
Geodetic latitudes are used and longitudes span from 0 to 360 degrees east positive
It represent a best fit of the Mars spheroid to the martian geoid (areoid):
class MarsBestFitAeroid(BaseGeodeticRepresentation):
    """
    A Spheroidal representation of Mars that minimized deviations with respect to the
    areoid following
        Ardalan A. A, R. Karimi, and E. W. Grafarend (2010)
        https://doi.org/10.1007/s11038-009-9342-7
    """

    _equatorial_radius = 3395.4280 * u.km
    _flattening = 0.5227617843759314 * u.percent
Now let’s define a new geodetic representation obtained from MarsBestFitAeroid but described by planetocentric latitudes.
class MarsBestFitOcentricAeroid(BaseBodycentricRepresentation):
    """
    A Spheroidal planetocentric representation of Mars that minimized deviations with
    respect to the areoid following
        Ardalan A. A, R. Karimi, and E. W. Grafarend (2010)
        https://doi.org/10.1007/s11038-009-9342-7
    """

    _equatorial_radius = 3395.4280 * u.km
    _flattening = 0.5227617843759314 * u.percent
As a comparison we define a new spherical frame representation, we could
have based it on BaseBodycentricRepresentation too.
class MarsSphere(BaseGeodeticRepresentation):
    """
    A Spherical representation of Mars
    """

    _equatorial_radius = 3395.4280 * u.km
    _flattening = 0.0 * u.percent
The new planetary body-fixed reference system will be described using the previous defined representations.
class MarsCoordinateFrame(BaseCoordinateFrame):
    """
    A reference system for Mars.
    """

    name = "Mars"
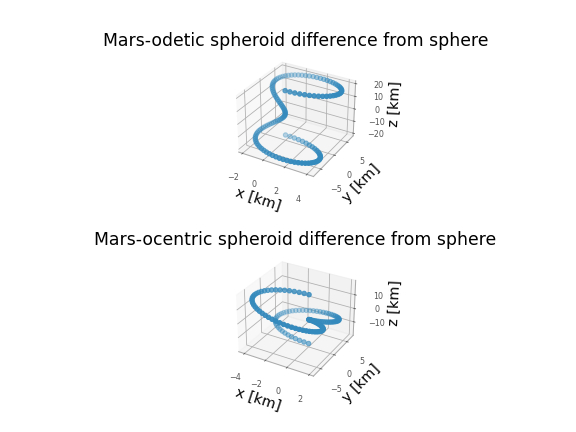
Now we plot the differences between each component of the cartesian
representation with respect to the spherical model, assuming the point on the
surface of the body (height = 0)
mars_sphere = MarsCoordinateFrame(
    lon=np.linspace(0, 360, 128) * u.deg,
    lat=np.linspace(-90, 90, 128) * u.deg,
    representation_type=MarsSphere,
)
mars = MarsCoordinateFrame(
    lon=np.linspace(0, 360, 128) * u.deg,
    lat=np.linspace(-90, 90, 128) * u.deg,
    representation_type=MarsBestFitAeroid,
)
mars_ocentric = MarsCoordinateFrame(
    lon=np.linspace(0, 360, 128) * u.deg,
    lat=np.linspace(-90, 90, 128) * u.deg,
    representation_type=MarsBestFitOcentricAeroid,
)

xyz_sphere = mars_sphere.represent_as(CartesianRepresentation)
xyz = mars.represent_as(CartesianRepresentation)
xyz_ocentric = mars_ocentric.represent_as(CartesianRepresentation)

fig, ax = plt.subplots(2, subplot_kw={"projection": "3d"})

ax[0].scatter(*((xyz - xyz_sphere).xyz << u.km))
ax[0].tick_params(labelsize=8)
ax[0].set(xlabel="x [km]", ylabel="y [km]", zlabel="z [km]")
ax[0].set_title("Mars-odetic spheroid difference from sphere")

ax[1].scatter(*((xyz_ocentric - xyz_sphere).xyz << u.km))
ax[1].tick_params(labelsize=8)
ax[1].set(xlabel="x [km]", ylabel="y [km]", zlabel="z [km]")

ax[1].set_title("Mars-ocentric spheroid difference from sphere")

plt.show()
Total running time of the script: (0 minutes 0.246 seconds)